
Graphs are widely used when you are a designer. You can create graphs in different software. But creating the graphs in Adobe Illustrator adds another level of excitement while you are working on it. You don’t have to switch to any other software to make any type of graph. You can easily color it, add values, and edit it whenever you wish.
Types of Graphs in Adobe Illustrator
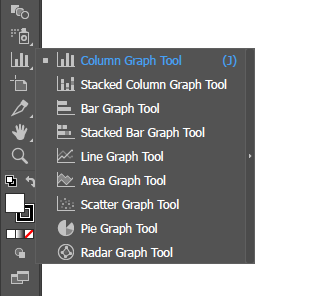
There are different graph tools that can create different graphs in Adobe Illustrator. Following is the list of graph tools in Illustrator.
Adobe Illustrator Graph Styles
- Column Graph Tool
- Stacked Column Graph Tool
- Bar Graph Tool
- Stacked Bar Graph Tool
- Line Graph Tool
- Area Graph Tool
- Scatter Graph Tool
- Pie Graph Tool
- Radar Graph Tool
Using all the given tools in Illustrator, you can make all these graphs easily.
The most amazing part is that you don’t have to put a lot of effort into making a graph in Illustrator. It’s so simple.
Select the graph you want to make from the Graph Tool, draw it on your artboard according to the size that you need, add the values, and do. The graph is created. The graph doesn’t have a lot of layers; just a single graph layer is available when you see it in the layer panel.
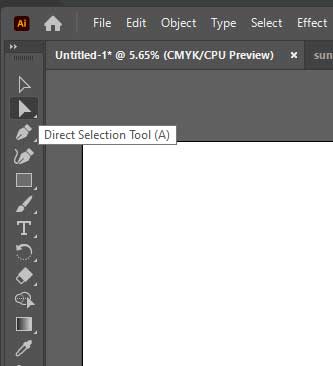
You can modify the changes of graphs in Illustrator by using the Direct Selection Tool.
If you don’t know how to make a graph and which type of graph you can make in Illustrator, then you are in the right place. In this tutorial, you will learn how to make a graph in Illustrator.
You can also learn:
Let’s start.
Make Graph in Adobe Illustrator
In this tutorial, we are going to show you a complete step-by-step method for making a graph in Adobe Illustrator. We made all the graphs with the same method. It just depends on which graph you select.
Graph Tool in Adobe Illustrator
If you are using the basic Essential mode in Illustrator, then you might not see the Graph Tool in your toolbar. To get the Graph Tool in your left toolbar, go to Switch Workspace > Essential Classic.
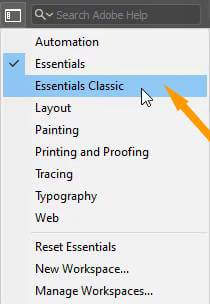
Your workspace will be modified and you will get “Graph Tool” on your left toolbar.

The Graph Tool list of the different available graphs is here. You can see all the different types of Graphs available.
How to Make Column Graph in Illustrator
Now let’s create a graph using one of the available graph tools on the artboard.
Column Graph Tool in Adobe Illustrator
Step 1: Go to your left toolbar and long-press or right-click on the Column Graph Tool.
Select any of your required graphs, but here we are selecting Column Graph Tool, the first one available on the list.
Step 2: After selecting the Column Graph Tool from your toolbar, click and drag on the artboard according to the required size, just like we did here.
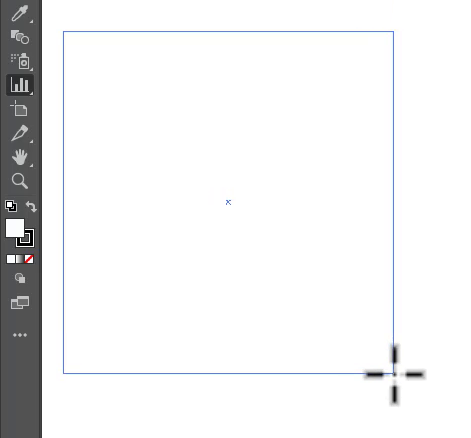
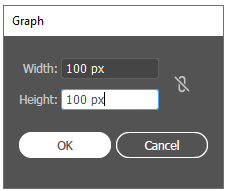
Step 2 (2nd Method): You can also make a graph according to the exact size by clicking once on the artboard. As you click on the artboard, the “Graph” panel will appear. Add the required width and height, and click OK.
Step 3: You can see that the “Column Graph” appeared on the artboard, with a data sheet.

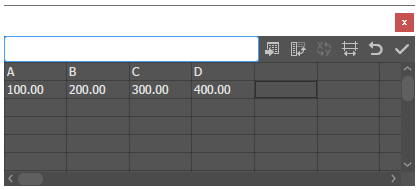
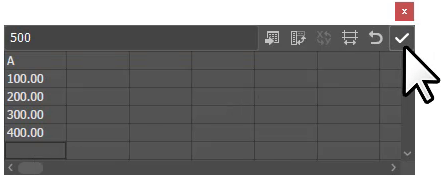
Step 4: Input the data into the sheet to see the graph representation of your data. Here, we have added some values to the datasheet.
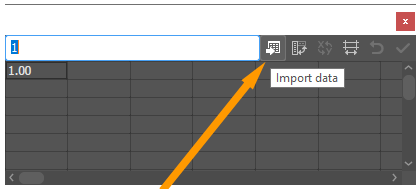
Note: If you already have a datasheet file, you can also import that file. All the data from the file will be used to represent the graph.
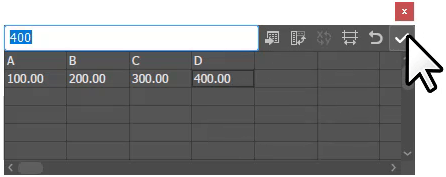
Step 5: After adding all the data, click on the “Apply” button available in the datasheet.
Step 6: Click on the “Close” sign.
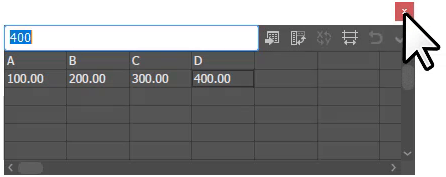
You can see that the graph represents the values that we have added to the datasheet.

Add Colors to Graph
If you want to add colors to the graph, use the Direct Selection Tool to select each item in the graph.

How to Make a Bar Graph In Illustrator
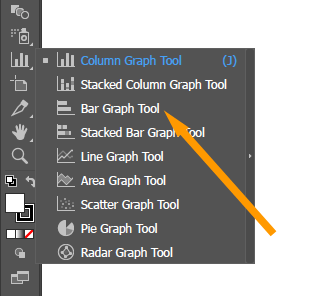
Step 1: From the left toolbar, right-click or long press on the Column Graph Tool, and select the Bar Graph Tool.
Step 2: Click and drag on the artboard to create a “Bar Graph”.

Step 3: As you release, the data sheet will appear. Add the data to the sheet, then click Apply.
Step 4: Click on Cross when you are done.
Bar Graph is created on the artboard.

If you want to change the colors of the bar graph, select each item in the graph by using the Direct Selection Tool and then color them.


How to Make a Line Graph in Illustrator
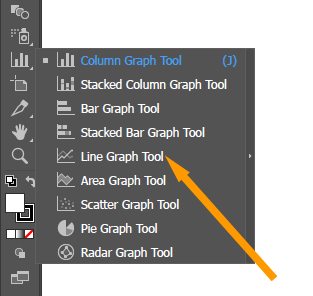
Step 1: Select the Line Graph Tool under the Column Graph Tool.
Step 2: Click and drag on the artboard to make a line graph.
Step 3: Add the values in the datasheet and click “Apply”.
Line Graph is created on the artboard.

You can also color it to make it more attractive.

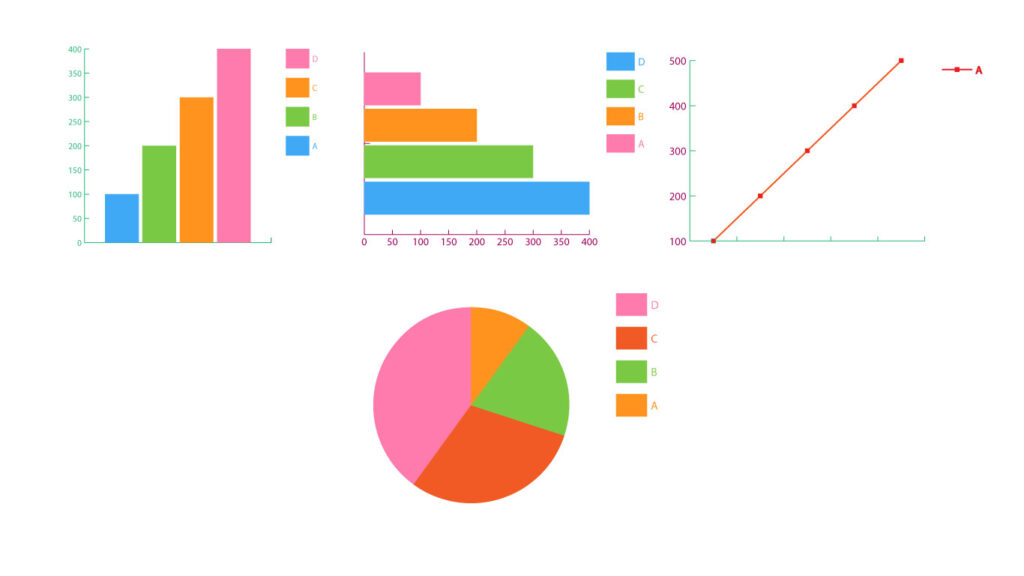
Pie Graph
Here you can see a pie graph that is created by using the same values as the Pie Graph Tool.
Learn Also: How to Make a Pie Graph in Illustrator

You have Learned to Make a Graph in Illustrator.
In this tutorial, you have learned how to make a graph in Adobe Illustrator. Now you can easily create any type of graph by following all the mentioned steps.
You can also watch the detailed video tutorial to learn How to Make a Graph in Illustrator that is given at the start.
Have More Questions?
If you have any questions related to Graph in Illustrator, then feel free to ask in the comment section below. We have also answered Most Frequently asked questions as well.
Expand Graph in Illustrator
Select the graph using the Selection Tool and go to Object > Ungroup. A warning dialogue box will appear, select Yes. Now right click on the graph and select Ungroup. Repeat if still there is any group remaining.
How to Resize Graph in Illustrator
To resize a graph in Illustrator, select the graph with the Selection Tool, Right Click > Transform > Scale > Uniform > Add value > OK.
The Graph will be resized according to the value, you added.
Download Free Graphs
You can also download all the graphs.
All Done! Enjoy.
Leave a Reply