
In Adobe Illustrator, you can create any Pie charts for your projects. Creating a Pie Chart is an effortless task if you know the right tool and steps. Such infographics play an important role in different types of projects. Whether you are creating one for your own self, any client, or a company, you must give out the best results.
Illustrator Pie Chart is the most amazing tool to work with. You can create multiple Illustrator Pie Charts in any color scheme.
You can also learn:
If you are new or you don’t have an idea to make a Pie Chart in Illustrator, then you are in right place. In this tutorial, we will give you step-by-step instructions to Make a Pie Chart in Illustrator. So Let’s start.
How to Make a Pie Chart in Illustrator 2022
This tutorial will surely help you to make a Pie Chart accurately, so you must follow the given guide to complete a Pie Chart in Illustrator.
Switch to Essentials Classic workspace
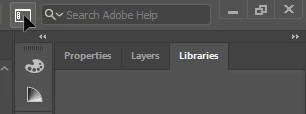
Step 1: Making a Pie Chart in a new workspace of Adobe Illustrator is a little bit tricky. So we will choose the Essentials Classic workspace. To do that, go to the right-hand side “Switch Workspace” option.
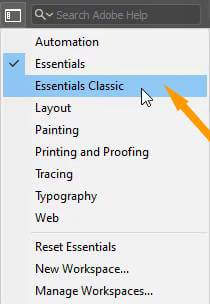
Step 2: From the drop down list, click on “Essentials Classic“.
Using Pie Graph Tool
Step 3: Now, go to your left-hand side toolbar and right-click on the “Column Graph Tool”.
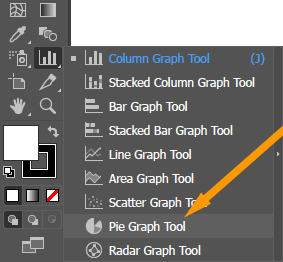
Step 4: Now you can simply choose the “Pie Graph Tool“. After choosing the “Pie graph Tool“, your cursor will be converted to a plus sign (+) shape.
Step 5: Now left-click and drag the cursor on your artboard. A black circle and a box will appear on your artboard.
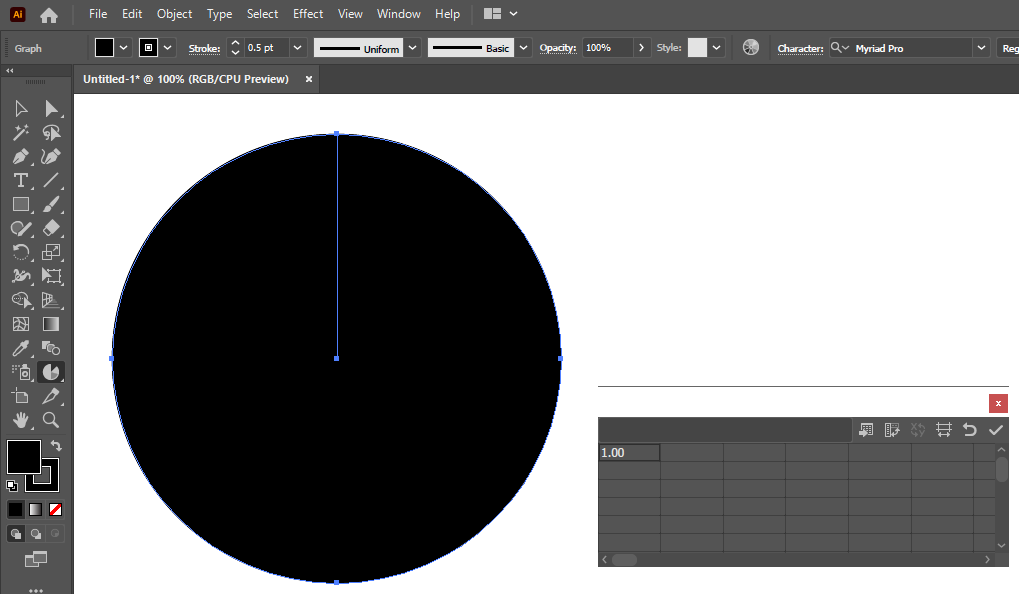
Step 6: In the given box, you can enter your values. Here I am inserting some data to show you how this tool will work.
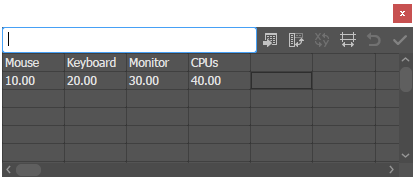
So, I inserted this dummy data to show you the result.
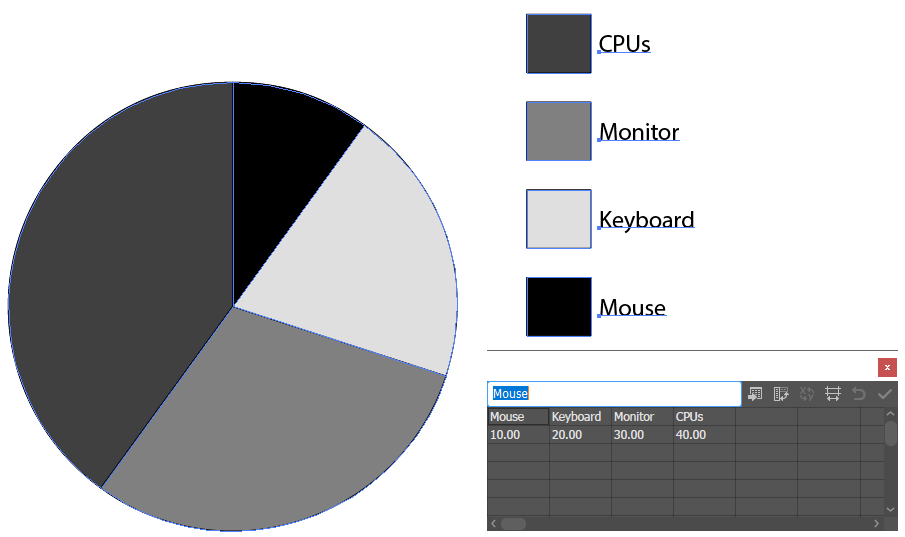
Look of Pie Chart
Here is the Pie Chart with default settings.
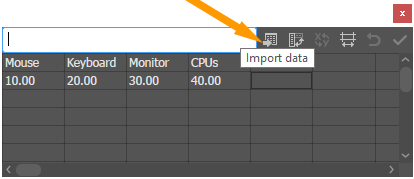
We can also import text-type data to make the Pie Chart. The import data option is available for us.
Now we will edit the colors of this Pie Chart. But first, we will close this box by pressing the little close (x) button on the right-hand side.
Coloring Pie Chart
To change the colors, first, select the “Direct Selection Tool” or press “A” from your keyboard.

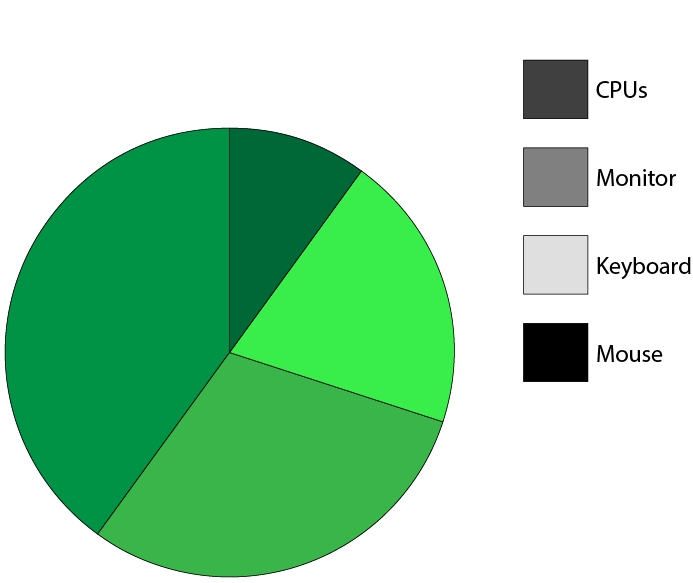
Now select any portion of your graph to change the color. Here I am selecting the darker color first.
Now go to the “Properties” Panel and in the “Appearance” section, choose “Fill” and select your desired color.
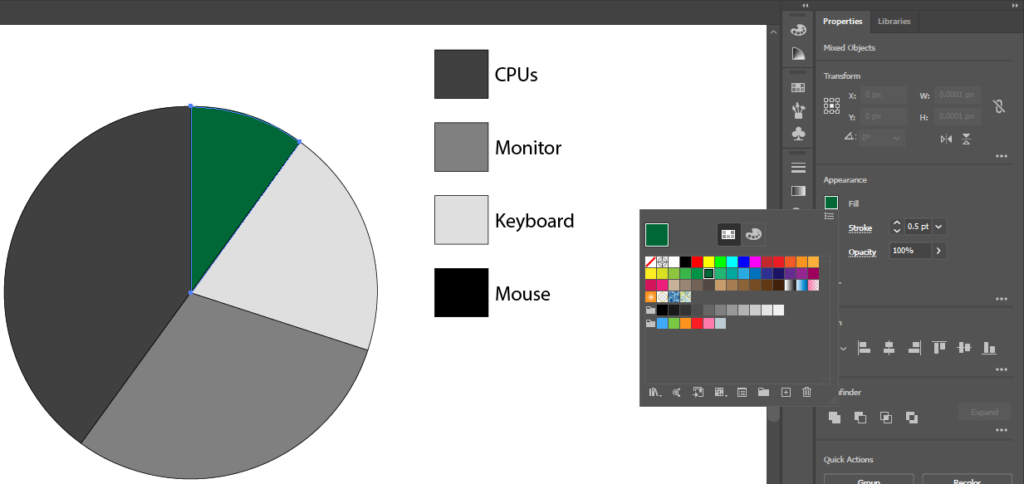
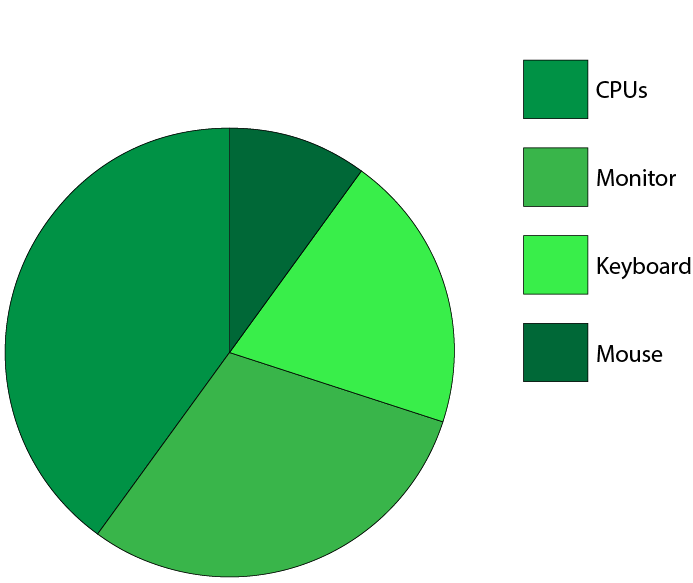
To change the colors of the right side boxes, simply select each box one by one with “Direct Selection Tool” and then choose to Fill color.
We can also edit this further by making changes to it. To insert more data into Pie Chart, Select the “Selection Tool” from your left toolbar or press “V” from your keyboard.

How to Data for Pie Chart in Illustrator
Pie Chart is editable in Illustrator. You can easily edit the data within the Pie Chart that we have created.
Now select the graph and right-click on it. Now choose the “Data…” option.
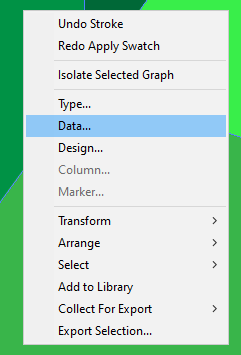
The box will appear. You can enter or edit the data.
After entering the data, simply press the close button. The graph will be changed accordingly.
Now as you have learned to Make a Pie Chart in Illustrator, you can easily create a Pie Chart according to your requirements. Illustrator Pie Chart can be very useful for different projects. You can use the graphic illustrations for the data by using Pie Chart in Illustrator.
Do You Have More Questions?
If you have any questions related to Pie Chart in Illustrator, then feel free to ask in the comment section below. We have also answered some Frequently Asked Questions here.
Resize Pie Chart in Illustrator
To resize a Pie Chart in Illustrator, select the Pie Chart using the Selection Tool > Right-click > Transform > Scale > Add the value to Uniform by percentage. Press OK. Pie Chart will be resized in Illustrator according to the value you give.
All Done! Enjoy.
Leave a Reply